


A critical aspect of design with fiber reinforced composites is the accurate characterization of the mechanical properties of the composite materials to compare against the induced loads and stresses from the application. This is particularly critical with composite materials where the manufacturing processes can have a significant impact on the delivered mechanical properties of the composite material and there is not an extensive materials database as is the case with more conventional engineering materials. Because the manufacturing processes are so critical to the delivered material properties, the test specimens for the material characterization must be manufactured using the same processes and procedures that will be used in the manufacture of the final parts. Careful control of the raw material specifications is also critical to achieve the required composite material properties. For the pre-impregnated fiber -- called towpreg – used by CEM, this means imposing tight specifications on the tow geometry and resin content of the impregnated composite fiber used in the fabrication of the composite rings.
During early composite design projects, CEM conducted extensive development and testing to evaluate the effects of manufacturing and curing processes on the delivered material properties of composite structures. To characterize the delivered material properties and to provide a quality control tool, CEM developed a hydroburst testing technique for characterizing the hoop (circumferential) properties of filament wound composite rings. Hydroburst testing provides a reliable and cost-effective test technique suitable for the generation of a statistically significant population of critical thermo-mechanical properties upon which to base material design allowables.
Testing Procedure:
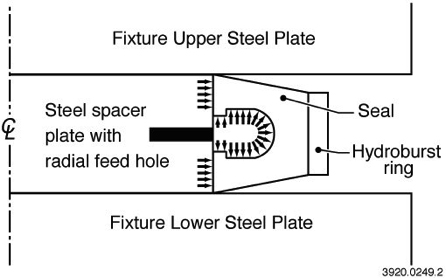
The hydroburst fixture applies a uniform internal pressure (supplied from an external hydraulic power supply) to a hoop wound composite specimen through a low friction custom PTFE seal. Hoop tensile stresses are developed in the test ring as the radial pressure of the seal loads the inside surface of the test ring.
Figure 1 below shows a schematic of the hydroburst test fixture, the upper and lower steel plates and spacer are clamped in a hydraulic press, eliminating the need for bolted joints in the test fixture and reducing the cycle time for testing multiple specimens. The seal used is a proprietary modified Teflon material and with a specialized profile to provide a more uniform radial pressure distribution across the inner face of the hydroburst sample. Control of the radial pressure distribution prevents axial bending of the specimen due to non-uniform radial deformation of the seal and minimizes axial strains in the test specimen.
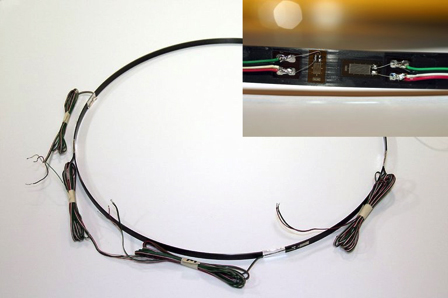
Each composite hydroburst specimen is instrumented with multiple strain gauges and a data acquisition system is used to record applied load (pressure) versus strain in the specimen over the entire duration of the test. Figure 2 is a picture of a typical hydroburst specimen showing the attachment of the strain gauges to the outer surface of the ring. Adhesion of the strain gauges to the specimen surface is critical to the accuracy of the test results and great care is taken with surface preparation and bonding procedures. Lead wires are soldered to the strain gauges after bonding and the extension wires are strain relieved with high peel-strength tape to prevent damage during handling and connection to the data acquisition system. Even with careful preparation, gauges frequently fail during the test sequence; multiple gauges are used for redundancy to allow data collection even if one or two of the gauges do not survive.
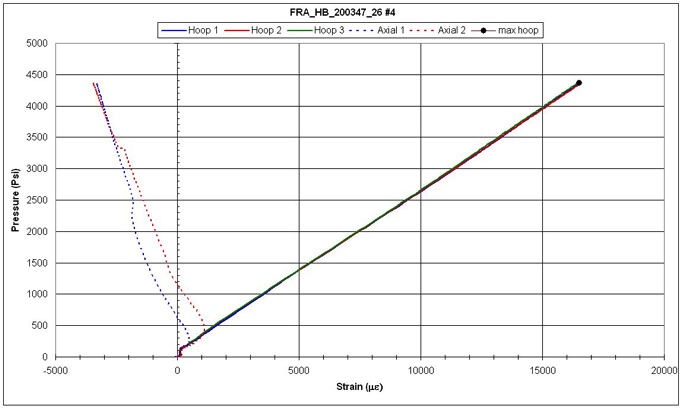
Hydroburst tests are typically conducted to failure to characterize the ultimate tensile strength/strain of the composite lamina; cyclic testing to evaluate fatigue properties can also be conducted with the hydroburst test fixture. Figure 3 is a representative graph of hydroburst test data. As internal pressure is increased (Y axis) the hoop strain in each of the three strain gauges increases until the ring fails catastrophically; this event is captured in the numerical data, but is typically edited from the graphical representation for clarity. The bold dot on the traces is the ultimate failure strain defined for use in the statistical analysis of the strain data, in this case approximately 16,550 m-strain.
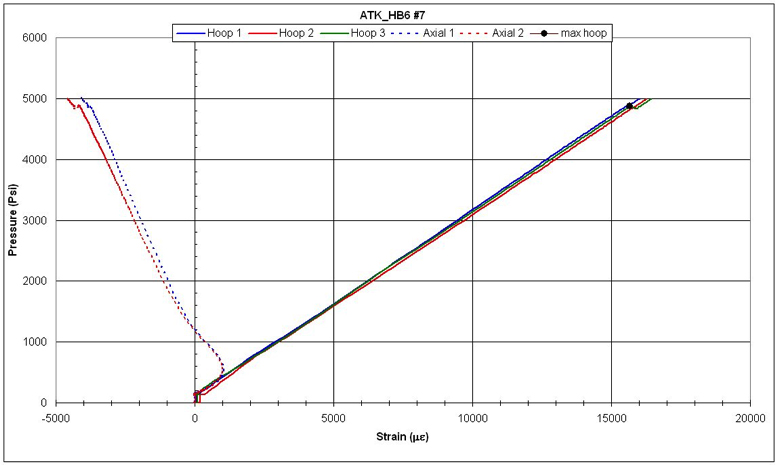
Assessment of the hydroburst test data is done manually for each test specimen and interpretation of the results is somewhat subjective. Frequently, the behavior of one or more strain gauges is aberrant or fails during the test, requiring sound engineering judgment in the interpretation of the hydroburst results. CEM defines the ultimate failure strain for a specimen as the point where the load vs. strain data becomes non-linear, a conservative approach that tends to underestimate the ultimate load carrying capacity of the specimen. Figure 4 is a graph of a hydroburst test showing a specimen where the ultimate failure strain was not defined by the catastrophic failure of the ring. In this test, the load vs. strain behavior of one of the three strain gauges becomes non-linear at approximately 15,700 m-strain, defining the ultimate strain of the specimen. The traces from the other two strain gauges continue in a linear fashion to over 16,000 m-strain before catastrophic failure of the ring. Using the lower strain value to characterize ring “failure” is a conservative way to define the allowable strains for the material.
The peak hoop lamina strength can be estimated using the thin-wall pressure vessel formula for cases where the wall thickness of the ring is very small compared to its diameter. This formula only applies for small values of t/D. For the CEM hydroburst test specimens, the ratios are typically on the order of 0.005 or less.
Statistical Data Analysis:
After collecting the hydroburst data from multiple samples, CEM uses the statistical processing methodology of Composite Material Handbook (CMH) -17 to define allowable stress levels for the composite lamina Non-proprietary computer software, STAT17 available from the MIL-HDBK-17 Secretariat is used to calculate A-basis and B-basis design allowables for the composite materials based on the hydroburst test data.
Because of the tight control on towpreg specifications and manufacturing processes, hydroburst data for samples from a given lot of material can typically be considered as unstructured. Unstructured data is typically evaluated using Wiebull, normal or lognormal distribution, or if these distributions do not apply, using nonparametric basis values. These statistical analysis techniques account for the number of samples and the standard deviation of the data set to calculate the A-Basis and B-Basis values.
An A-Basis value is a statistically based material property representing a 95% lower confidence bound on the first percentile of a specified population of measurements. In other words, there is a 95% confidence that 99% of the specimens will meet or exceed the A-basis value. A B-basis value represents a 95% lower confidence bound on the tenth percentile of a specified population of measurements. In other words, there is a 95% confidence that 90% of the specimens will meet or exceed the B-basis value. As a further safety measure, CEM typically applies an additional factor of safety relative to the A-Basis and B-Basis design allowables, typically a factor 1.2 to 1.5 between the A-Basis design allowable and applied strain.
An additional statistical evaluation conducted to evaluate the probability of success. This evaluation uses a Student-T distribution that enables consideration of the trial specimen size relative to the final component dimensions, in this case the 0.5 in. length of the hydroburst specimen to the 35 in. length of the flywheel rotor. The results of this evaluation are often referred to as the “number of nines” as a reference to how close the probability of success approaches certainty, a value of 1. For example, 6 nines would represent a probability of success of 0.999999+, or a one-in-a-million chance of failure.
Contact

Mr. Scott Pish
s.pish@cem.utexas.edu
512-232-1672